Instrument What You Can't See
Why I run a Prometheus/Loki/Grafana stack on every backend and none of it on my homelab. The same rule, applied twice.
At the end of my DeepDame writeup I mentioned something almost in passing: the backend was designed for an LGTM observability stack, and in production it ran on a single VM on a desktop in my room. Both halves of that are still true. Every backend I work on runs Prometheus, Loki, and Grafana. My homelab, the thing that desktop actually is, runs none of it.
People read that as a contradiction. Either I’m lazy about my own infrastructure, or I’m over-engineering my projects. It’s neither. It’s one rule applied twice, and the rule is the whole point of this post: instrument what you can’t otherwise see, and don’t pay for what you already can.
What my homelab actually tells me
My homelab is not small. More than twenty services across a few VMs and LXCs on Proxmox. By the usual homelab-blog logic, that’s exactly the kind of setup that “needs” a metrics stack. Spin up Prometheus, scrape everything, build Grafana dashboards, feel professional.
I don’t run any of it. Here’s what I run instead.
Uptime-Kuma checks every service and answers one question: is it up. At any moment I can open it and see the whole fleet at a glance. Right now that’s fifteen services green and nothing down.
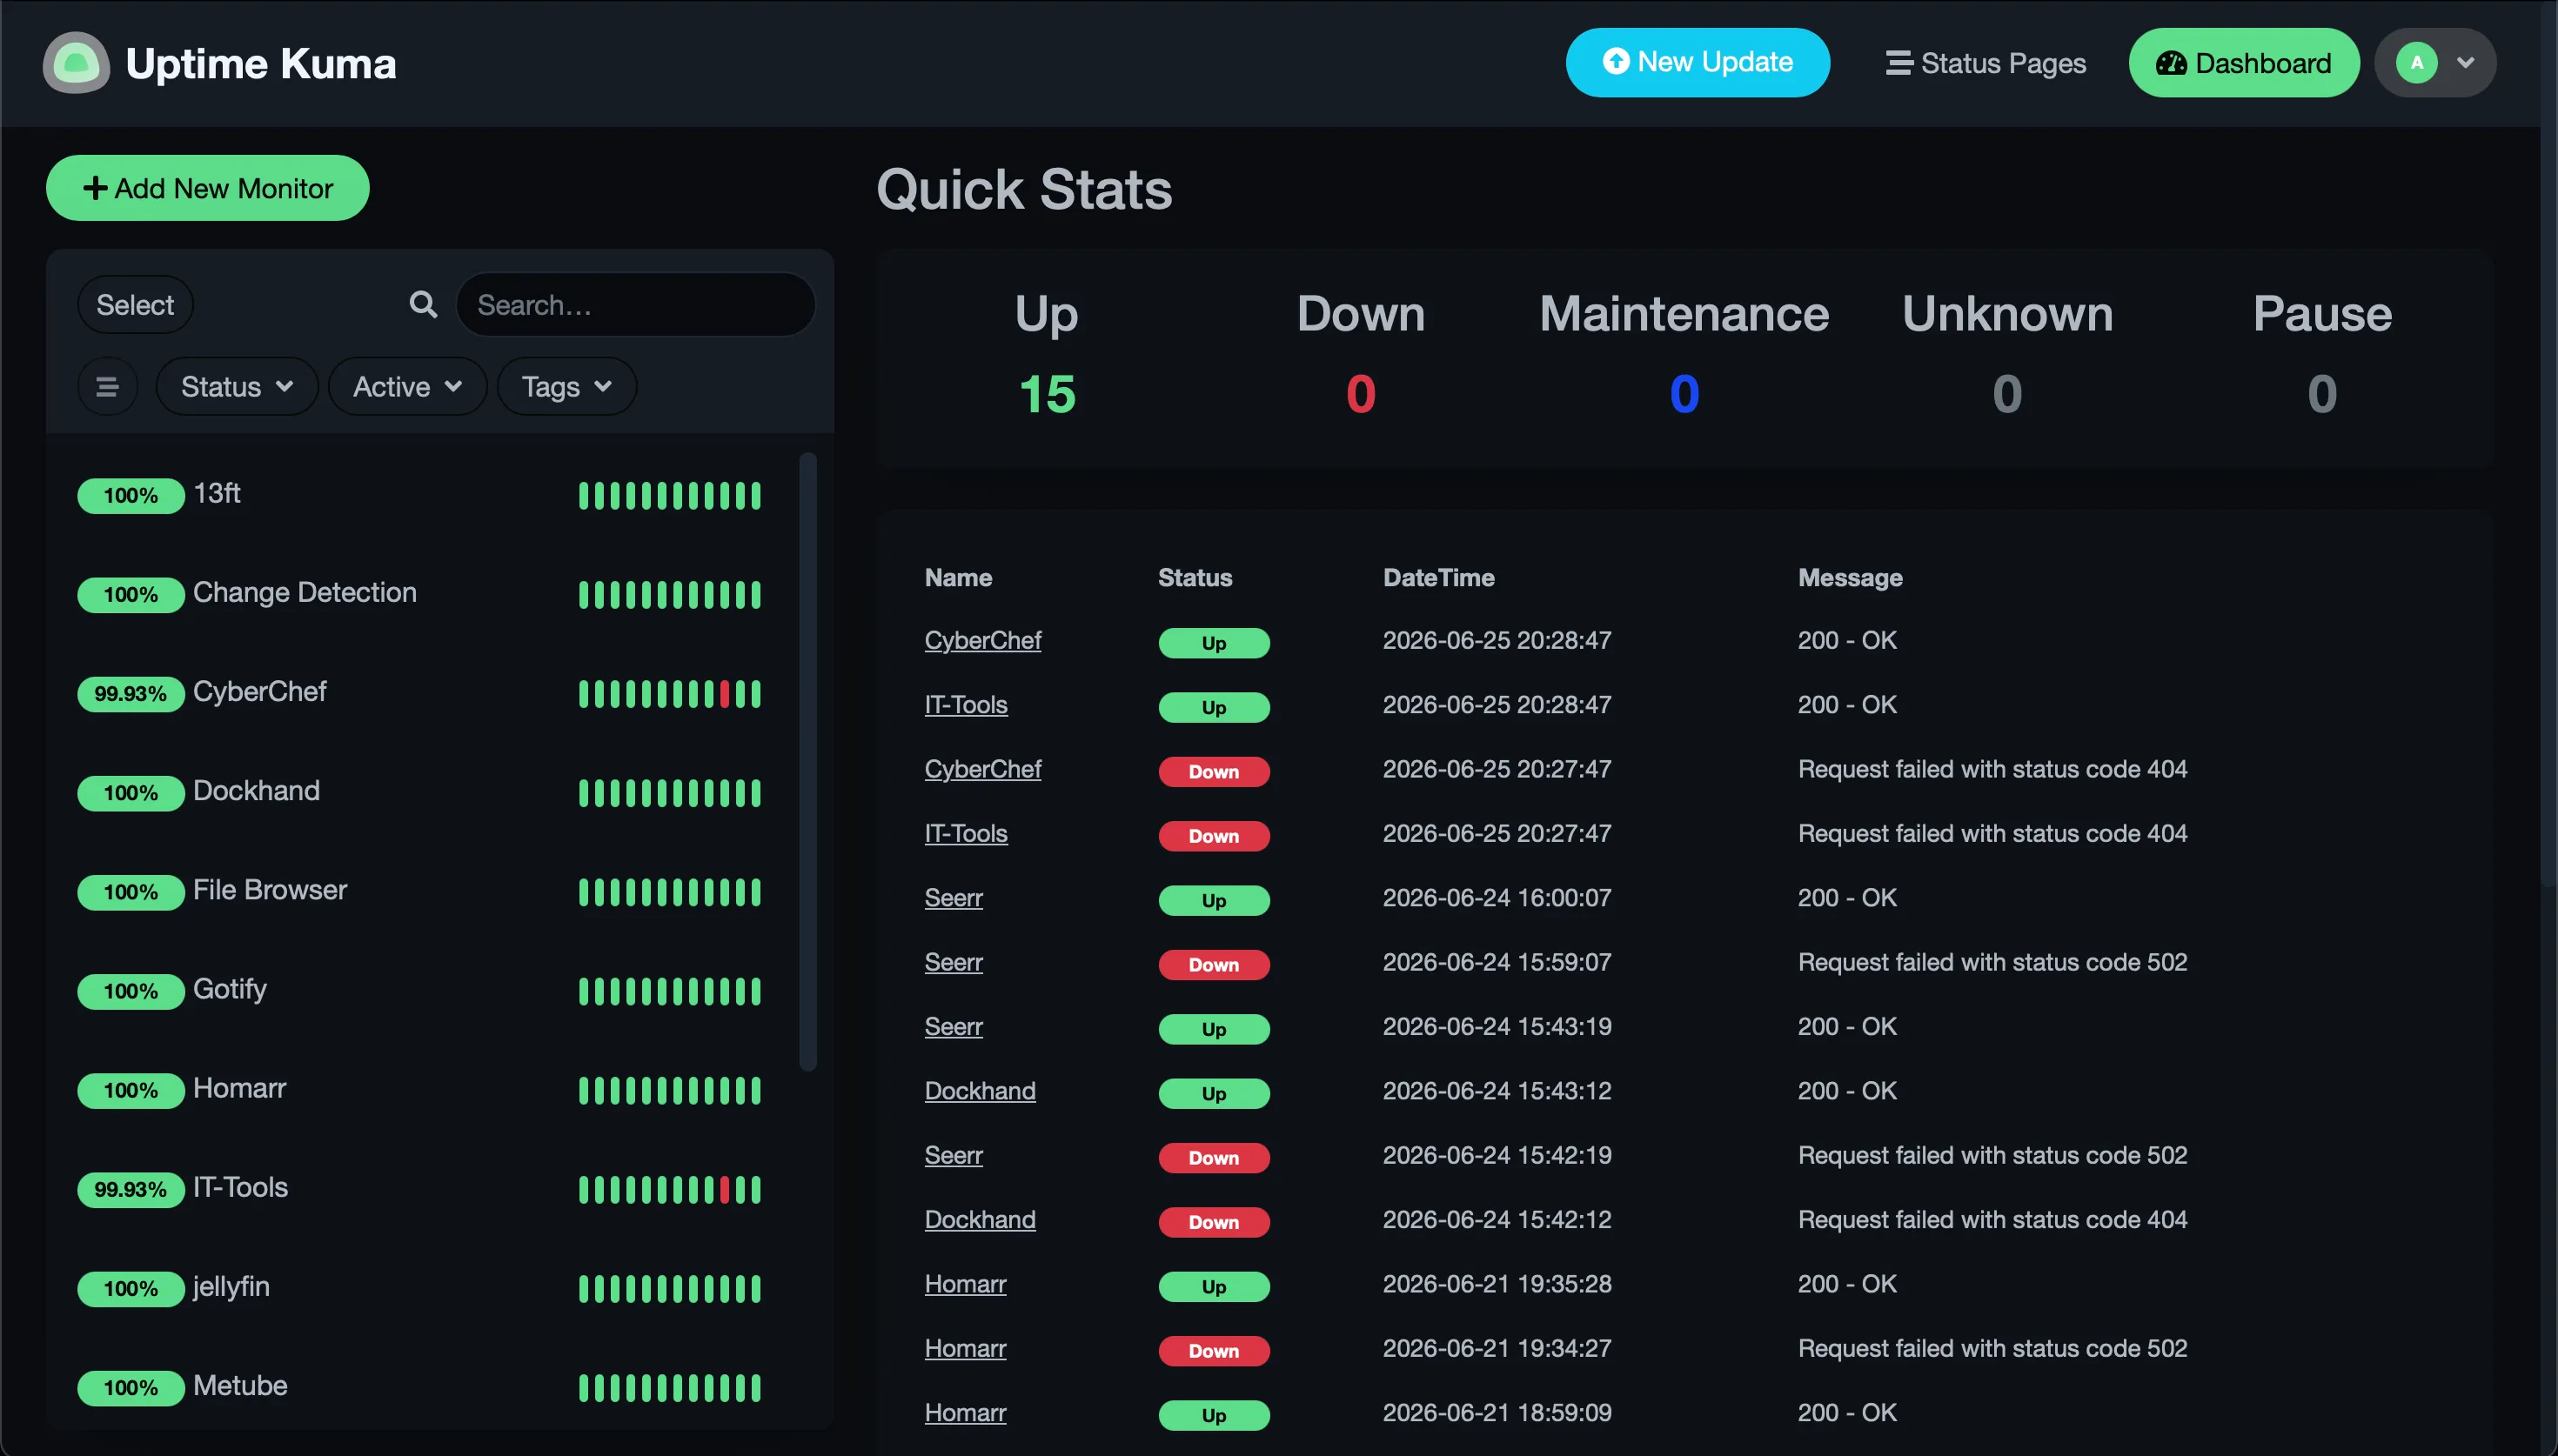
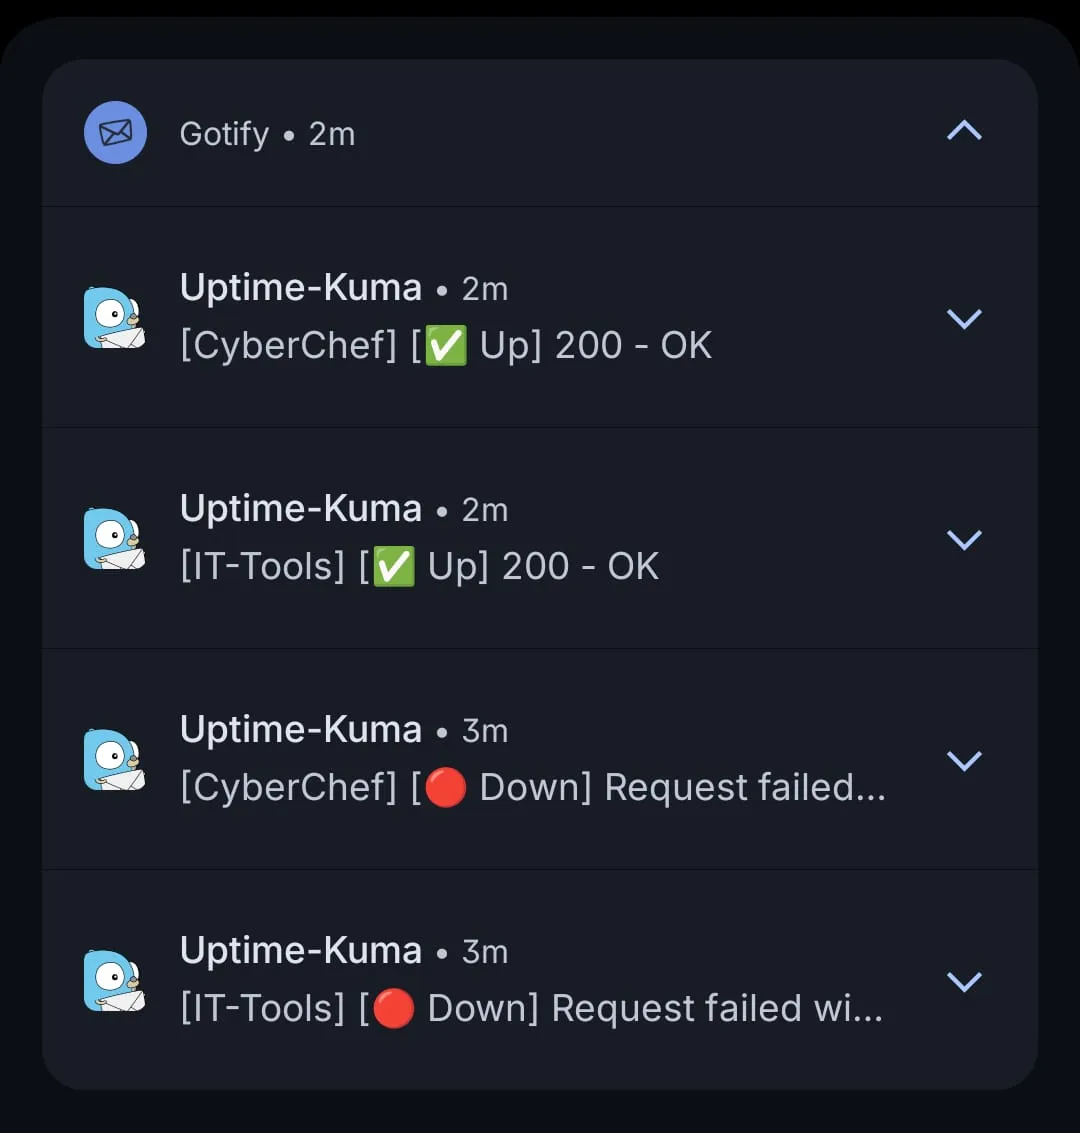
When something does go down, Uptime-Kuma doesn’t quietly update a dashboard I’ll never open. It pushes to Gotify. And Gotify is the one place everything reports into. Every service that can send a notification is wired to it. Proxmox itself sends to it. If something on this network has something to tell me, it lands in the same feed on my phone.
To show what that looks like, I stopped two services, IT-Tools and CyberChef, and started them again. Within seconds the down events and then the recovery arrived on my phone. No dashboard required.
The piece that ties it together is Homarr. One screen: every container with its live CPU and memory, the Proxmox VMs and LXCs, Pi-hole’s blocking stats, and the latest Uptime-Kuma events inline.
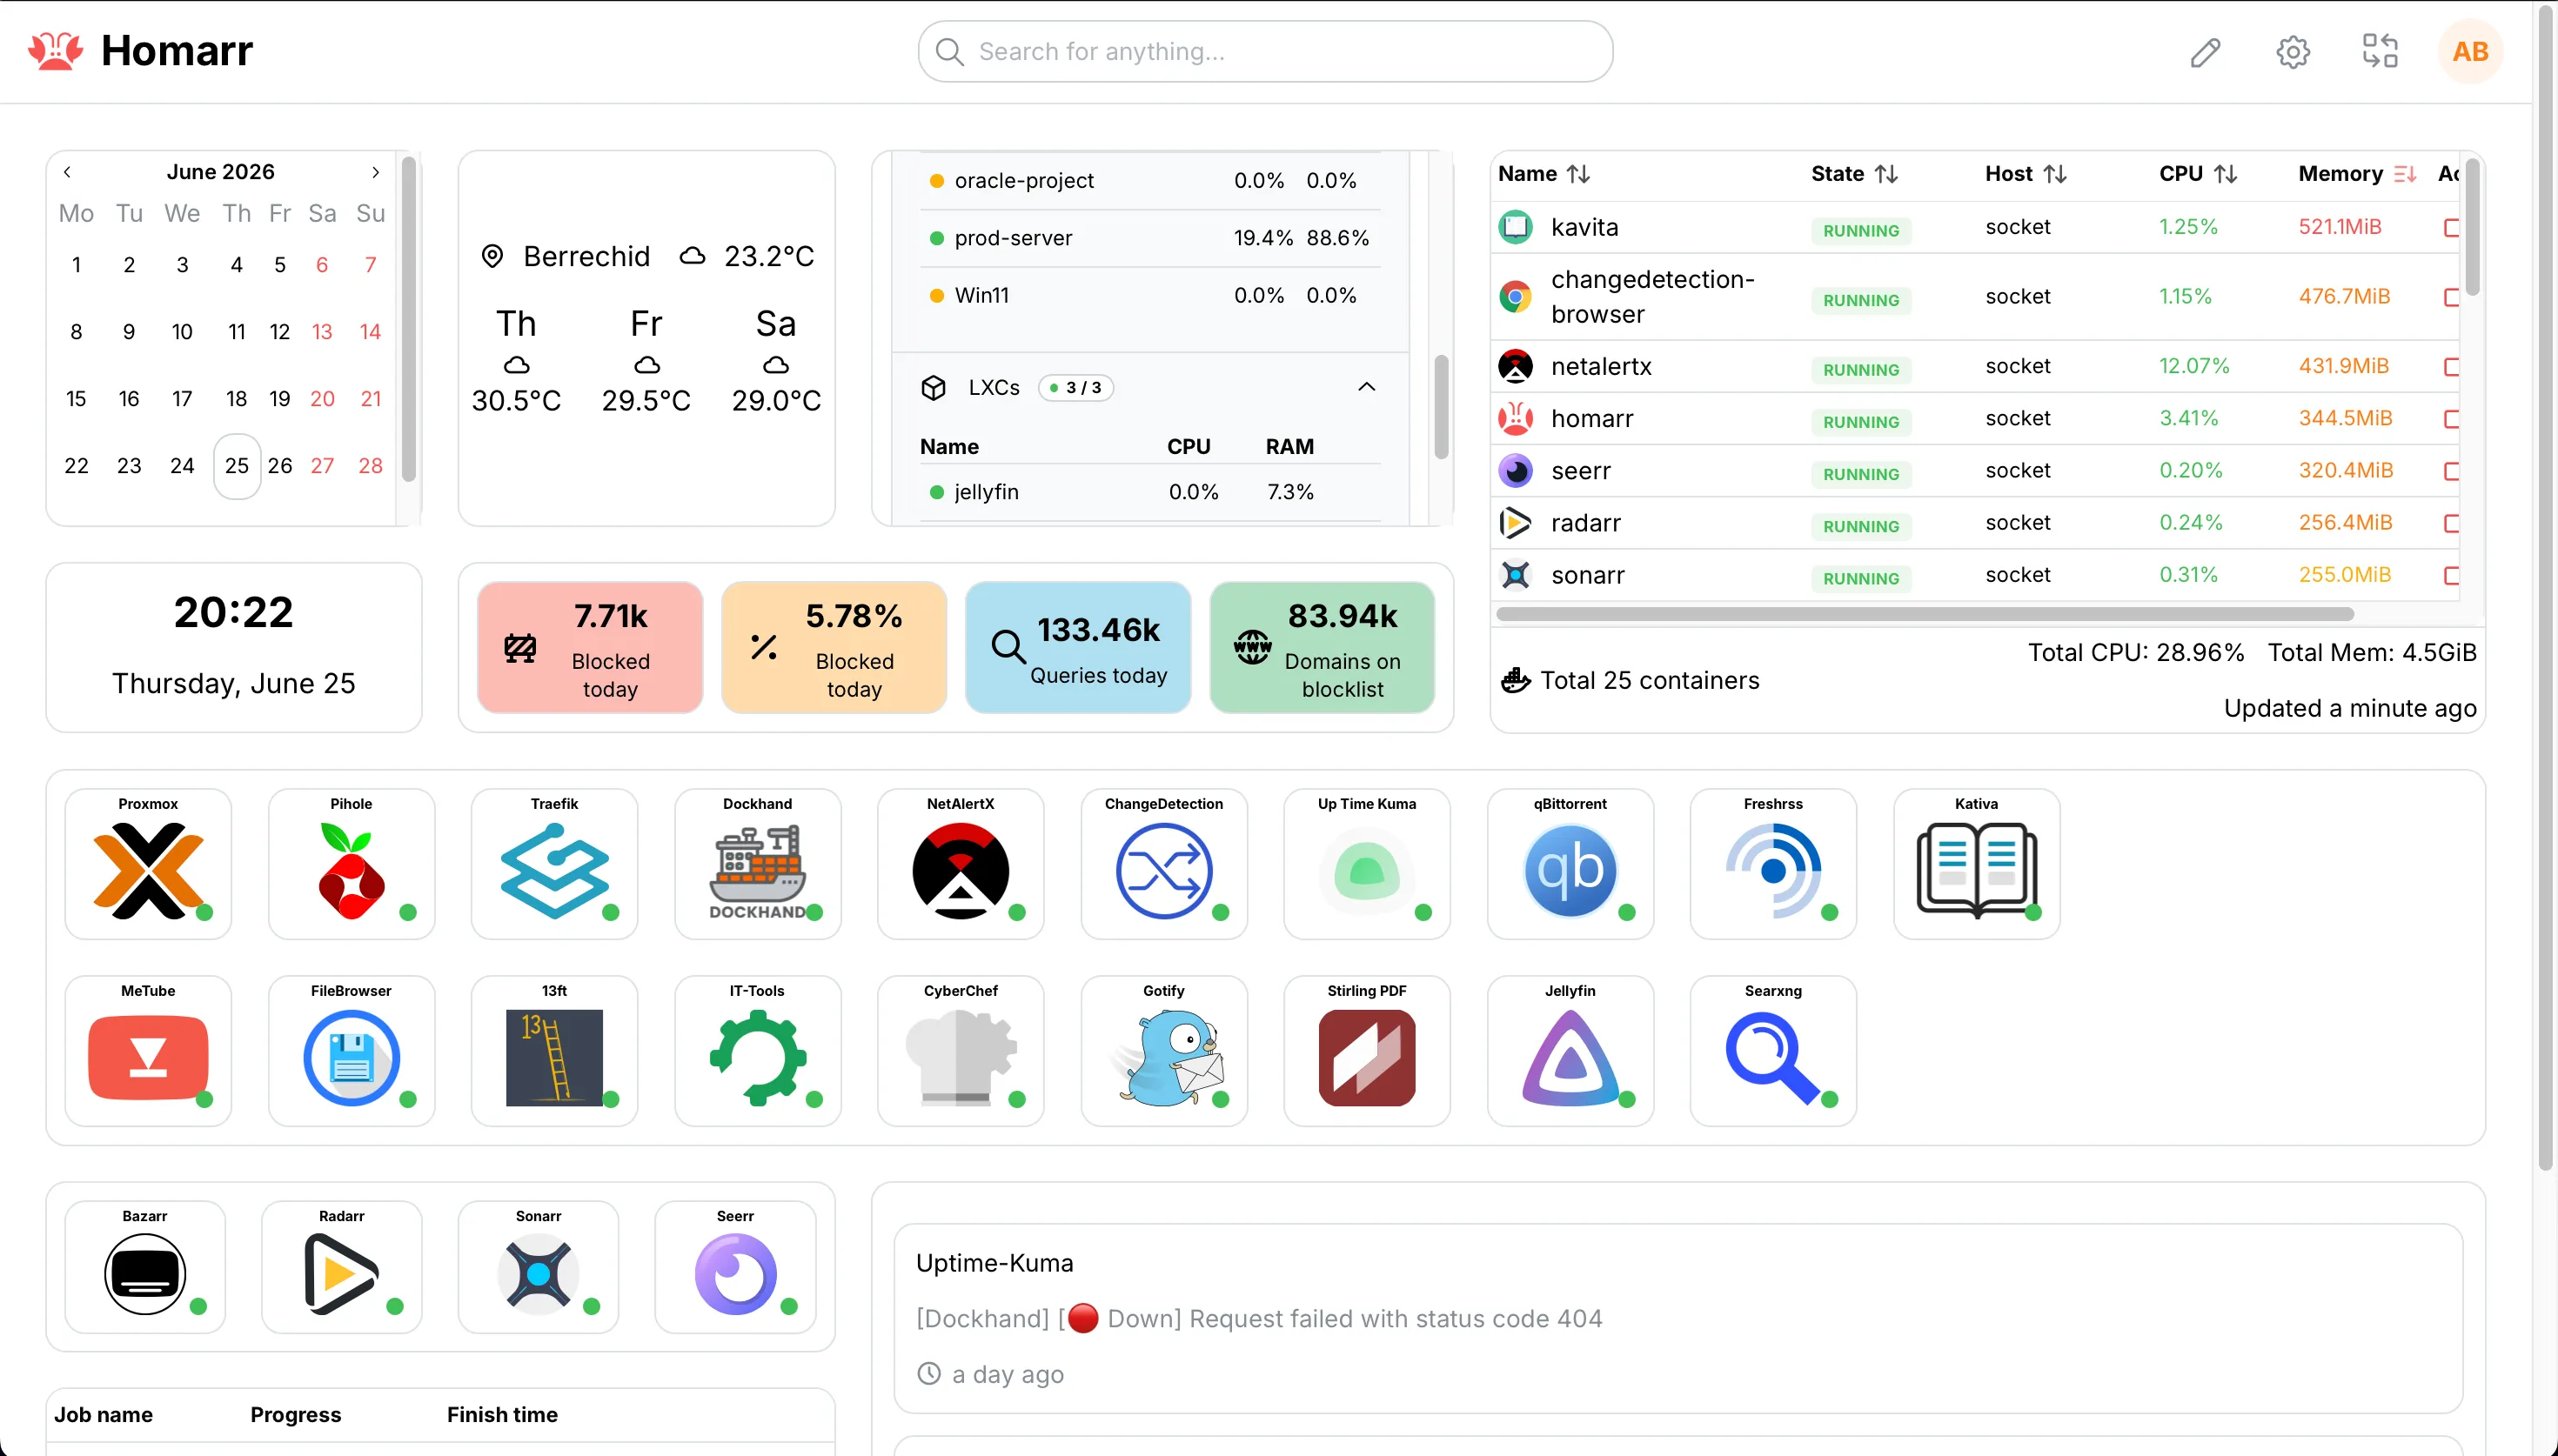
The important part is what Homarr isn’t. It doesn’t collect anything. It reads from things that are already running, the Docker socket, the Proxmox API, Pi-hole, Uptime-Kuma, and lays them out in one place. No new pipeline, no storage, no scraping. Just a view onto signals that already exist.
NetAlertX watches the network and tells me when a device shows up that shouldn’t. And when I want to know what a single box is doing right now, btop and the Proxmox UI show me CPU, RAM, and IO live, per VM and per node.
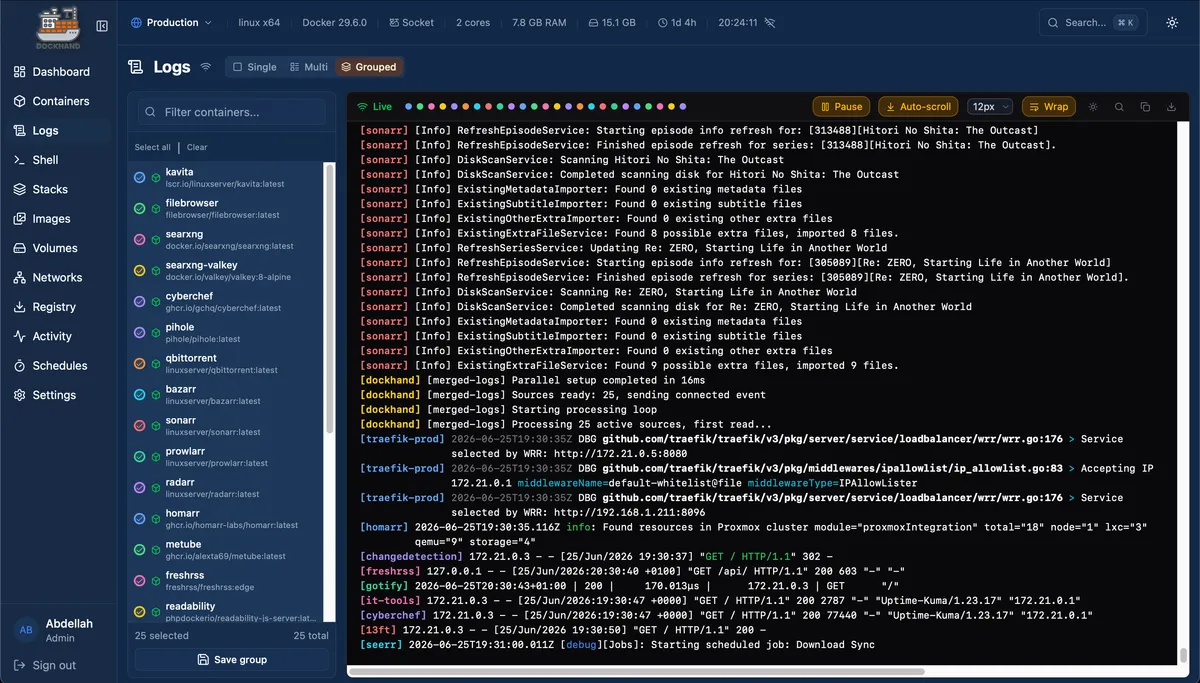
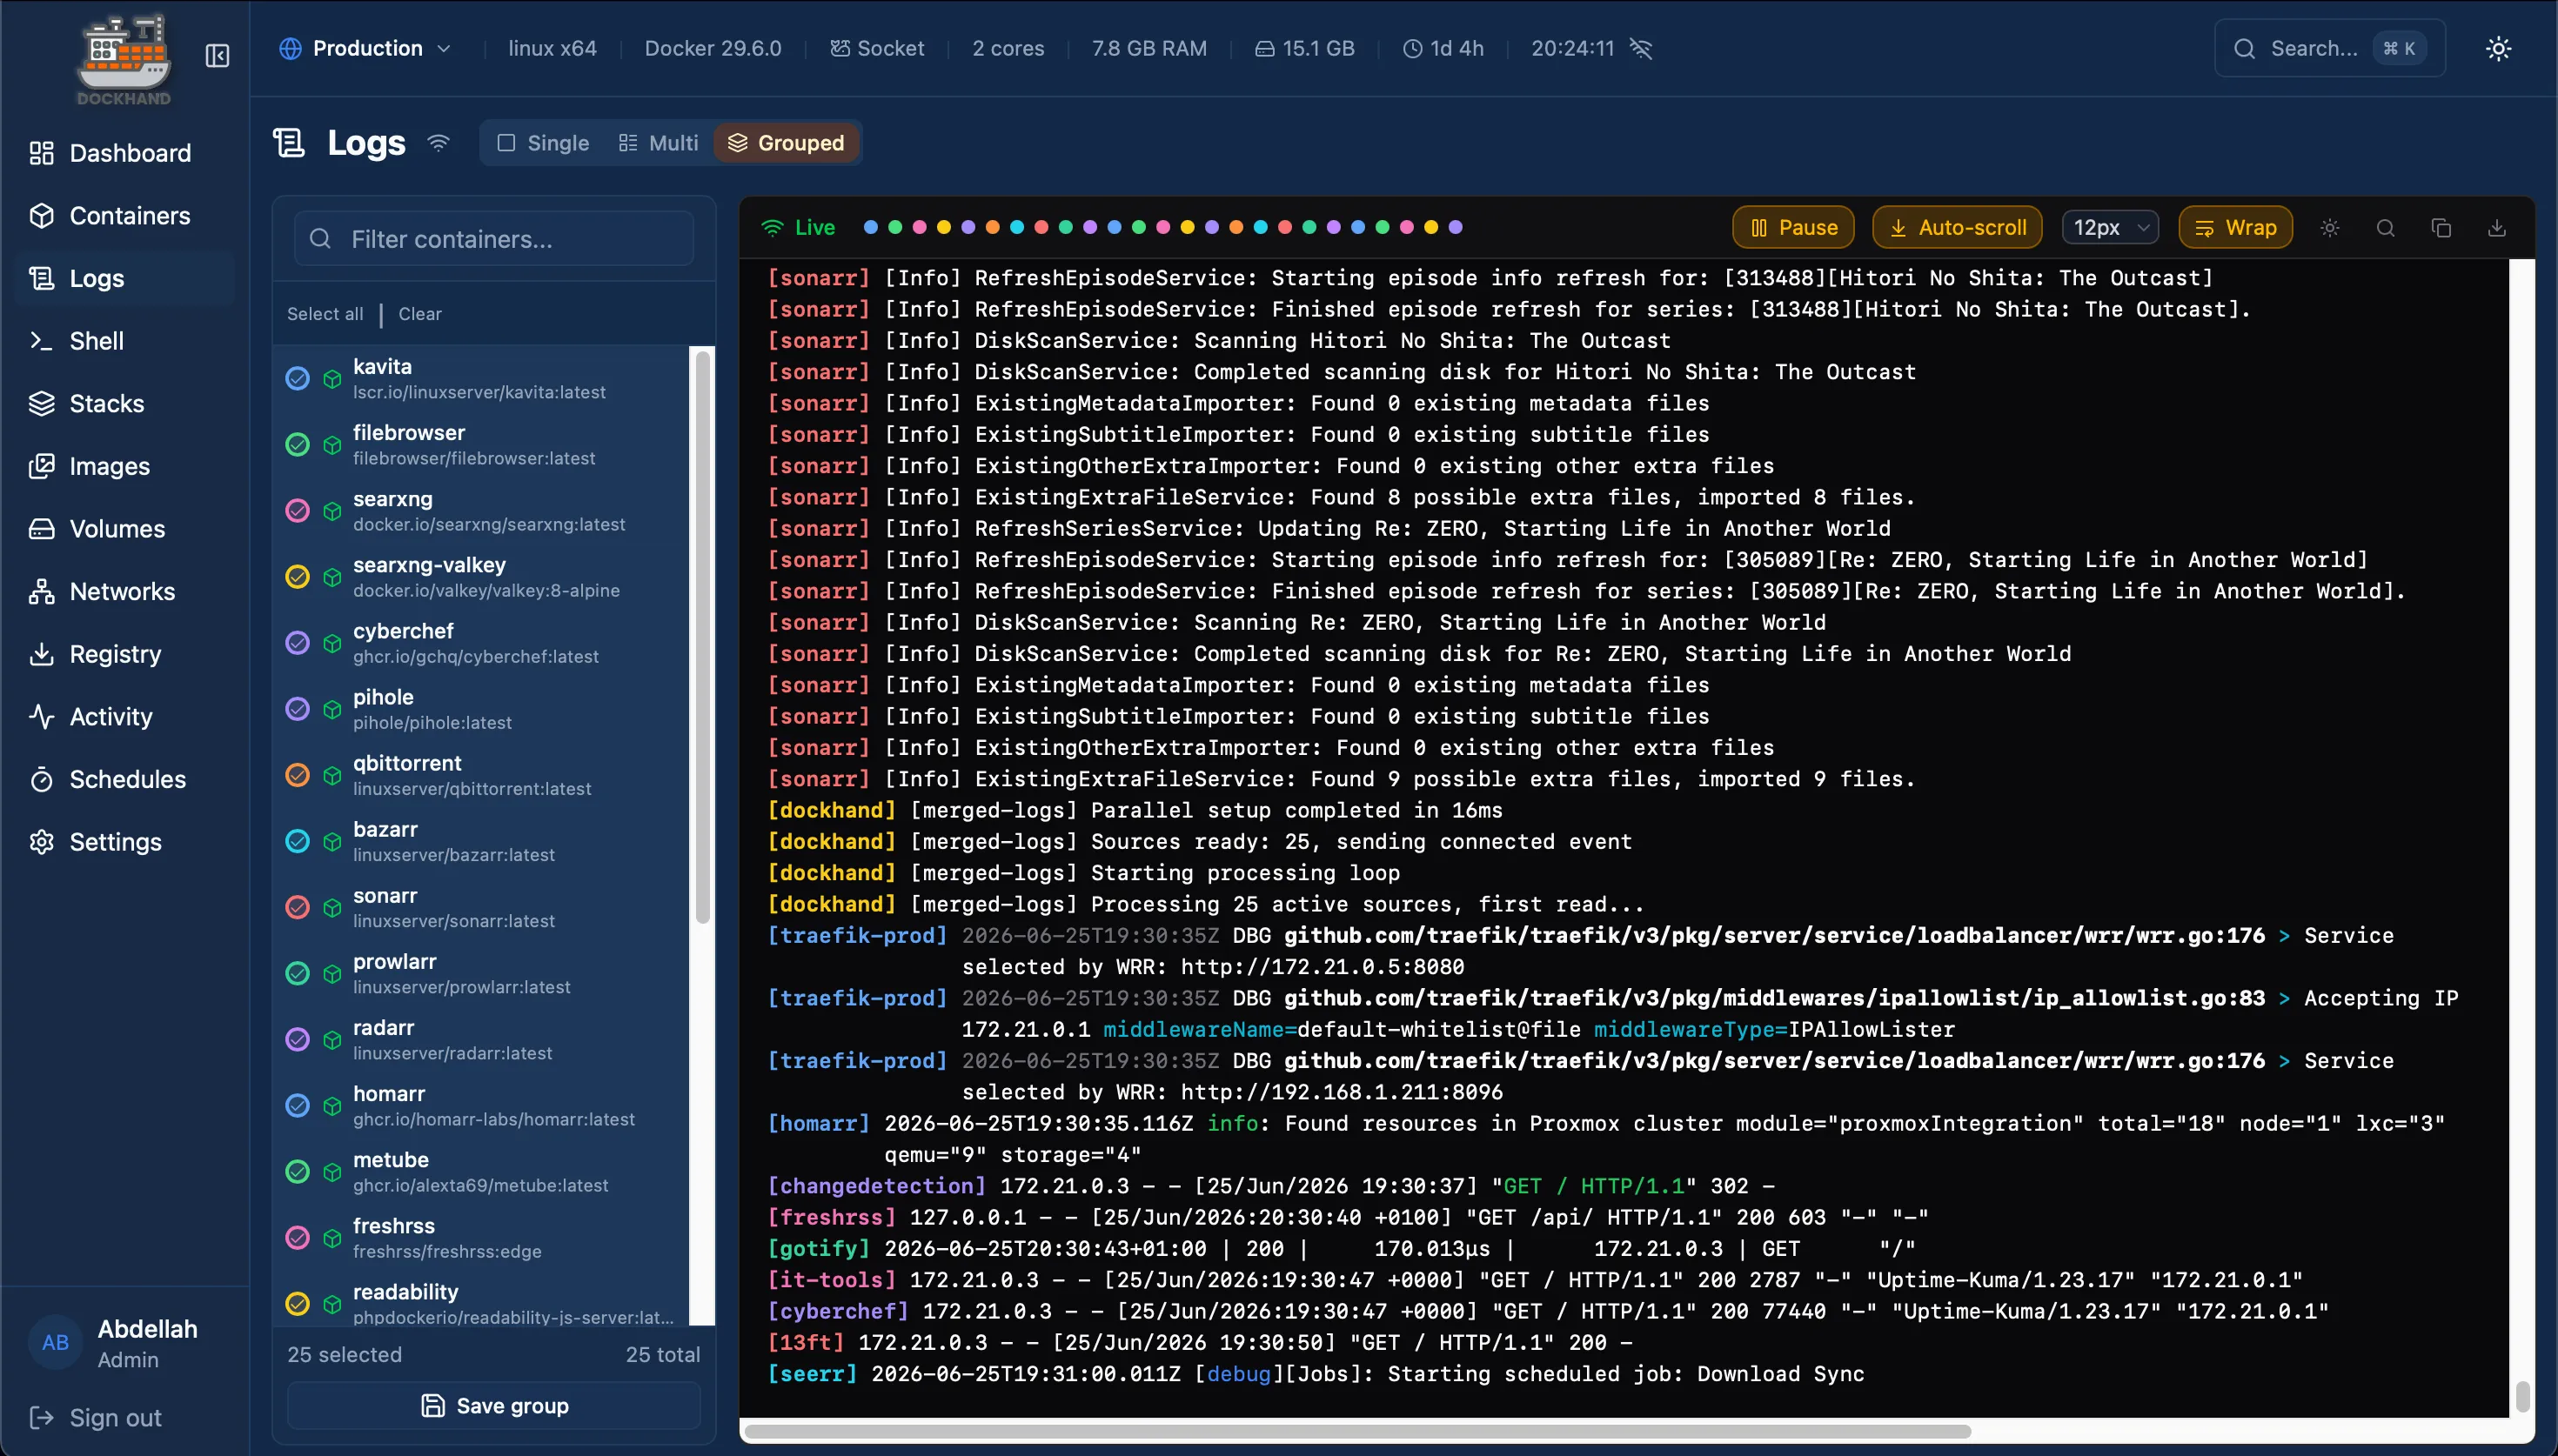
Logs used to be the one thing that meant SSH-ing into three machines to find anything. Dockhand fixed that. It pulls every container’s logs across every host into one place, so when I actually need to read them, they’re already collected and filtered in front of me.
Notice what all of that has in common. Every signal I care about is already surfaced. I don’t have to instrument anything to see it.
Why I don’t add metrics to it
Here’s the part the tutorials skip. My homelab runs on a weak machine. The bottleneck is the hardware. It’s the RAM, sometimes the network card, occasionally the CPU. I know this not because I built a dashboard for it but because it’s the only thing it ever is, and btop shows it the second it happens.
A metrics stack would not tell me anything new. It would tell me the RAM is full, which I already know, while consuming the RAM that is the problem. On a box this size, Prometheus and Grafana aren’t free observers sitting politely in a corner. They’re more load, competing for the exact resource that’s already scarce, to re-collect data that’s already on screen.
I almost added LGTM anyway, more than once. It integrates so cleanly that “might as well” is a constant temptation. That temptation is the trap. “It’s easy to add” is not the same as “it earns its place.” For my homelab, it doesn’t. Everything I’d want out of it, I already have, for free, without the overhead.
Why I run it on every backend
Now the other half, because this is where the same rule points the opposite way.
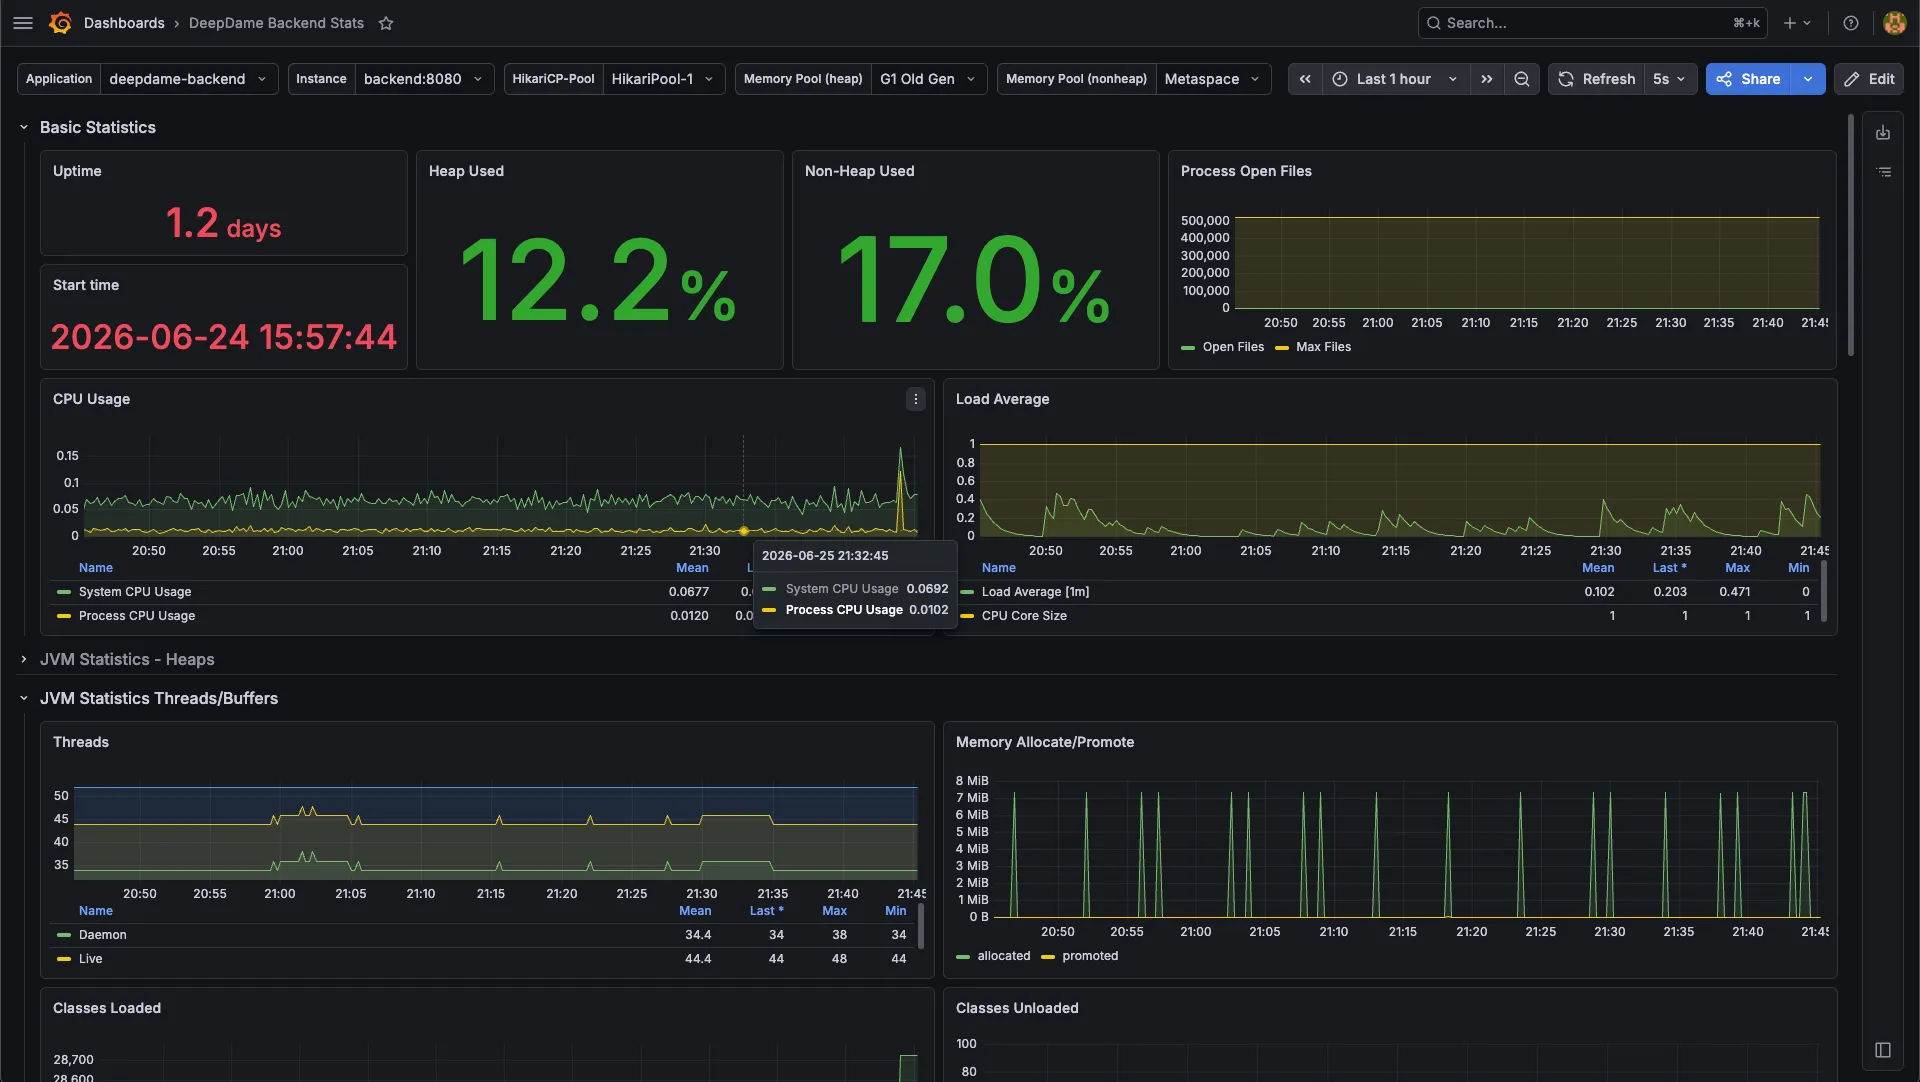
On every backend I work on, DeepDame included, we run Prometheus, Loki, and Grafana. On DeepDame specifically I own the production Compose that ships it: the app, its databases, and the observability stack in a single deployable file, with Prometheus scraping the Spring Boot Actuator endpoint.
The reason isn’t that backends are more important than my homelab. It’s that on a backend, the signals I care about are invisible.
I cannot eyeball how many requests per second a service is handling. I can’t see the database connection pool filling up. I can’t watch p95 latency drift, or notice that traffic spikes every day at a particular hour, or catch that one endpoint is quietly doing most of the work. None of that shows up in btop. The app doesn’t print it. The only way to see it is to instrument the service and let something collect it over time.
And Spring Boot makes that almost free. Actuator and Micrometer expose the JVM internals, HTTP timing, request counts, and connection-pool stats, and Prometheus scrapes them on an interval. Suddenly the things that were dark are on a graph: requests, connections, the busy hours, the slow paths. That is information I have no other way to get, and it is worth every megabyte the stack costs.
That’s the whole difference. On the homelab the overhead buys me nothing I don’t already have. On a backend it buys me the only view I’ll ever get into what the service is actually doing.
The rule
So here it is, stated plainly, because it’s the thing I’d want past-me to have known:
Observability earns its overhead exactly when the signal is otherwise invisible.
Backend internals are invisible by default: request rates, pool saturation, latency percentiles, the shape of traffic over a day. Instrument them. A small homelab’s limits are visible by default: a full RAM bar, a saturated NIC. Don’t.
Same engineer. Opposite decision. One rule.
What would change my mind
I want to be honest about the limit of this. I don’t skip the metrics stack at home because homelabs shouldn’t have one. I skip it because on this hardware, with these services, the trade lands on “don’t.” Change the inputs and the answer flips, and I’d be the first to flip it.
Two things would do it. Better hardware, because the overhead only matters when you’re short on the exact resources Prometheus and Grafana eat. On a box with room to spare, that objection is gone. And heavier services, the kind I can’t run today, with internal state and behavior I couldn’t read off a glance. Those are exactly the workloads where the interesting signal goes dark, and dark signal is the whole reason to instrument.
That isn’t an exception to the rule. It is the rule. Instrument what you can’t see, when you can afford to. Today the cost is high and there’s nothing I can’t already see, so the answer is no. Give me the hardware and the services to justify it, and the same rule says yes. The follow-up to this post is probably the one where I finally stand up LGTM at home, under the honest title: now it earns its place.
What this taught me
The instinct I had to fight wasn’t laziness. It was the opposite: the pull to add the proper, professional-looking thing because it was available and it was easy. Most homelab content online is someone bolting Grafana onto a setup that never asked for it, because that’s what you’re supposed to do.
I’d rather match the tool to the actual darkness in the system. My homelab is already lit, so it doesn’t need more instruments. My backends are dark in the places that matter, so they need every one. The discipline isn’t running observability everywhere. It’s knowing where you can already see.
Thanks for reading.